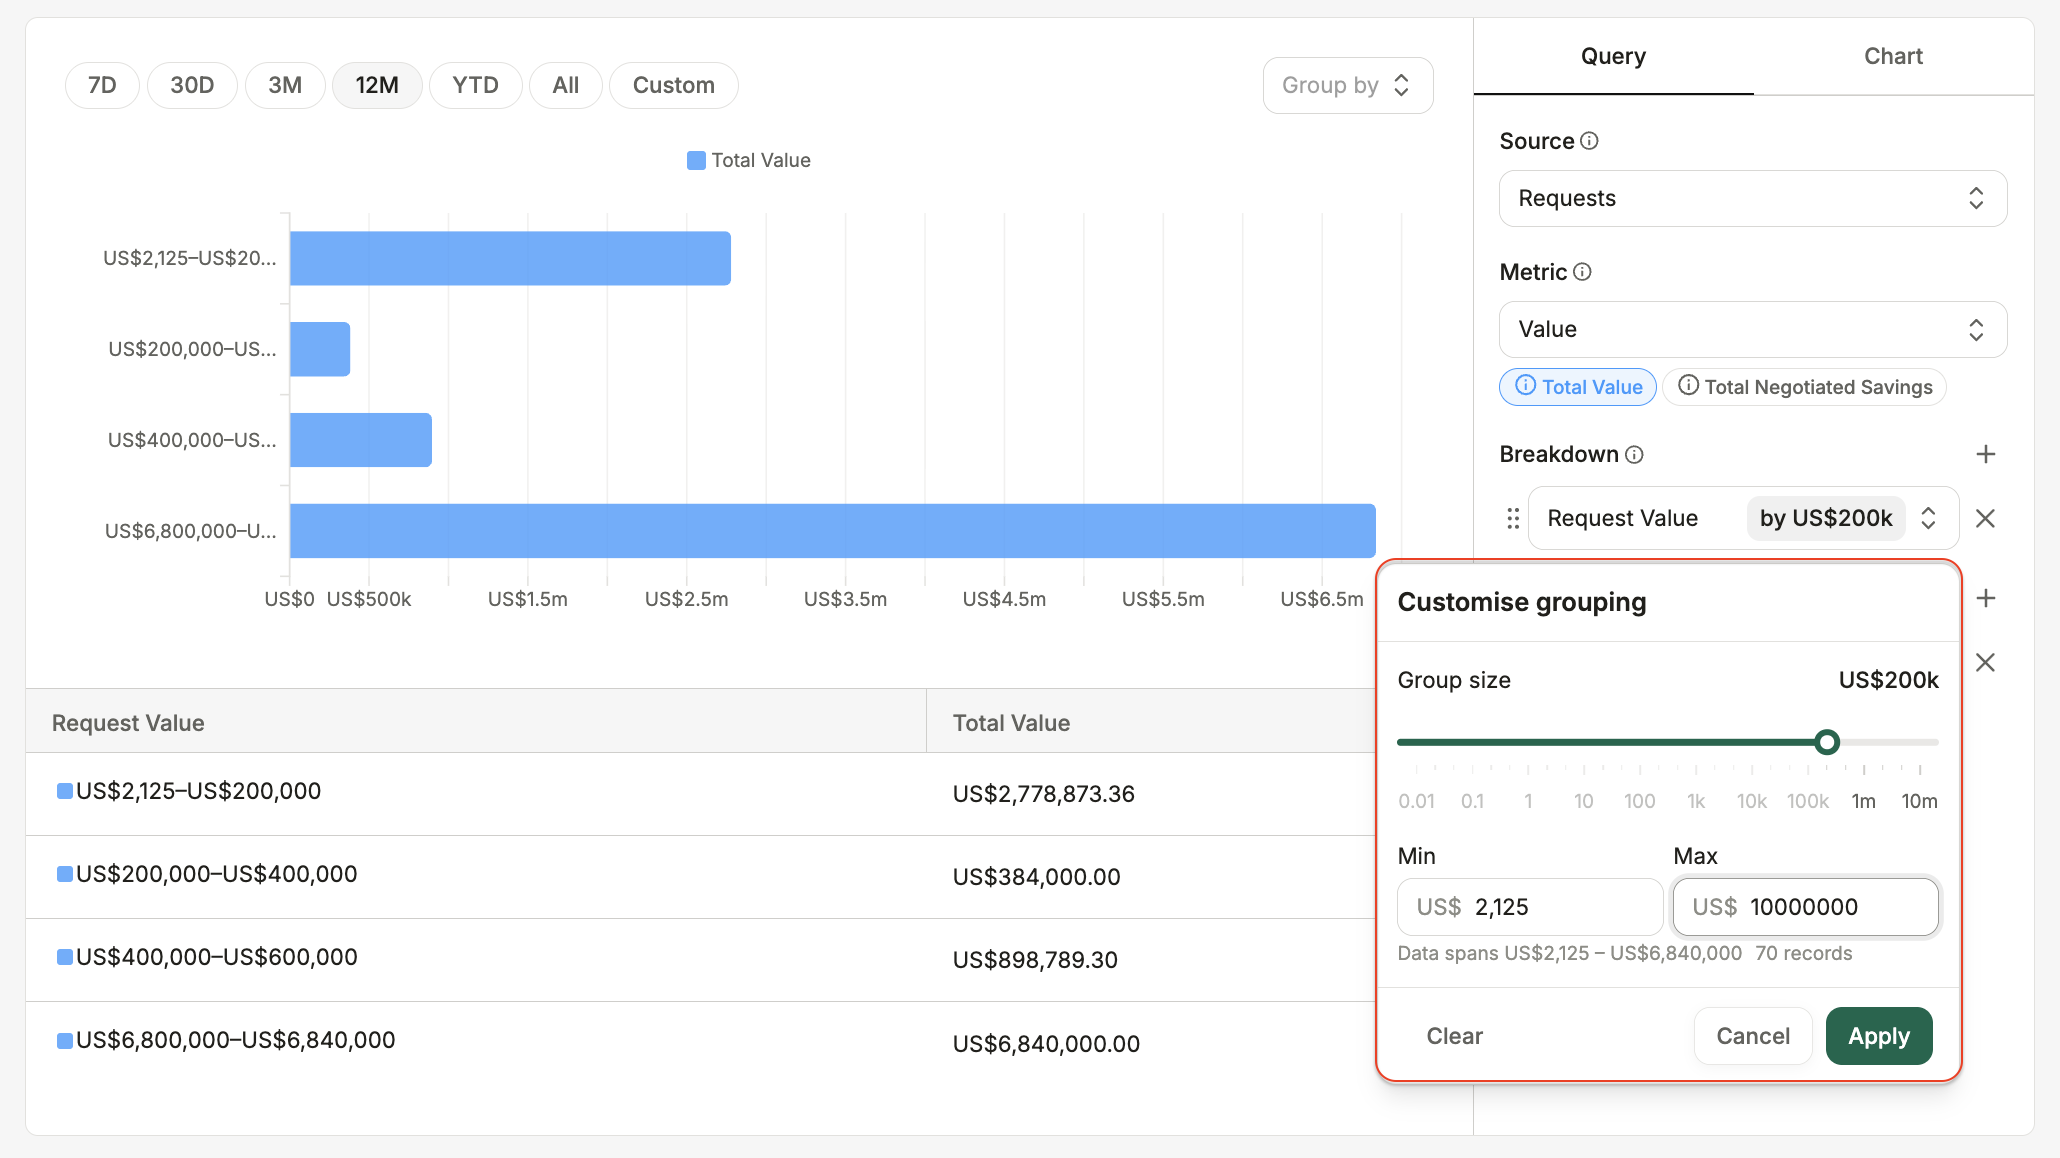
How to: Group value ranges into readable charts
Last updated: September 29, 2026
Group numeric values into ranges that you define. This makes charts easier to read and helps you identify patterns across values such as contract amounts or savings.
How to group numbers
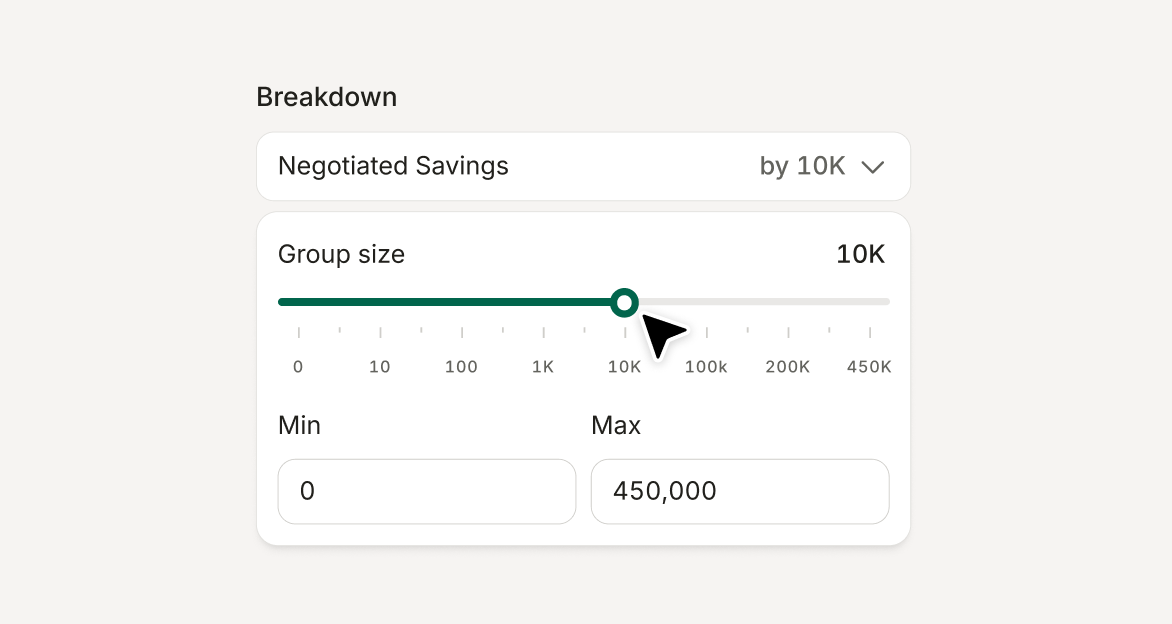
Select a numeric field as your breakdown and open the grouping settings.
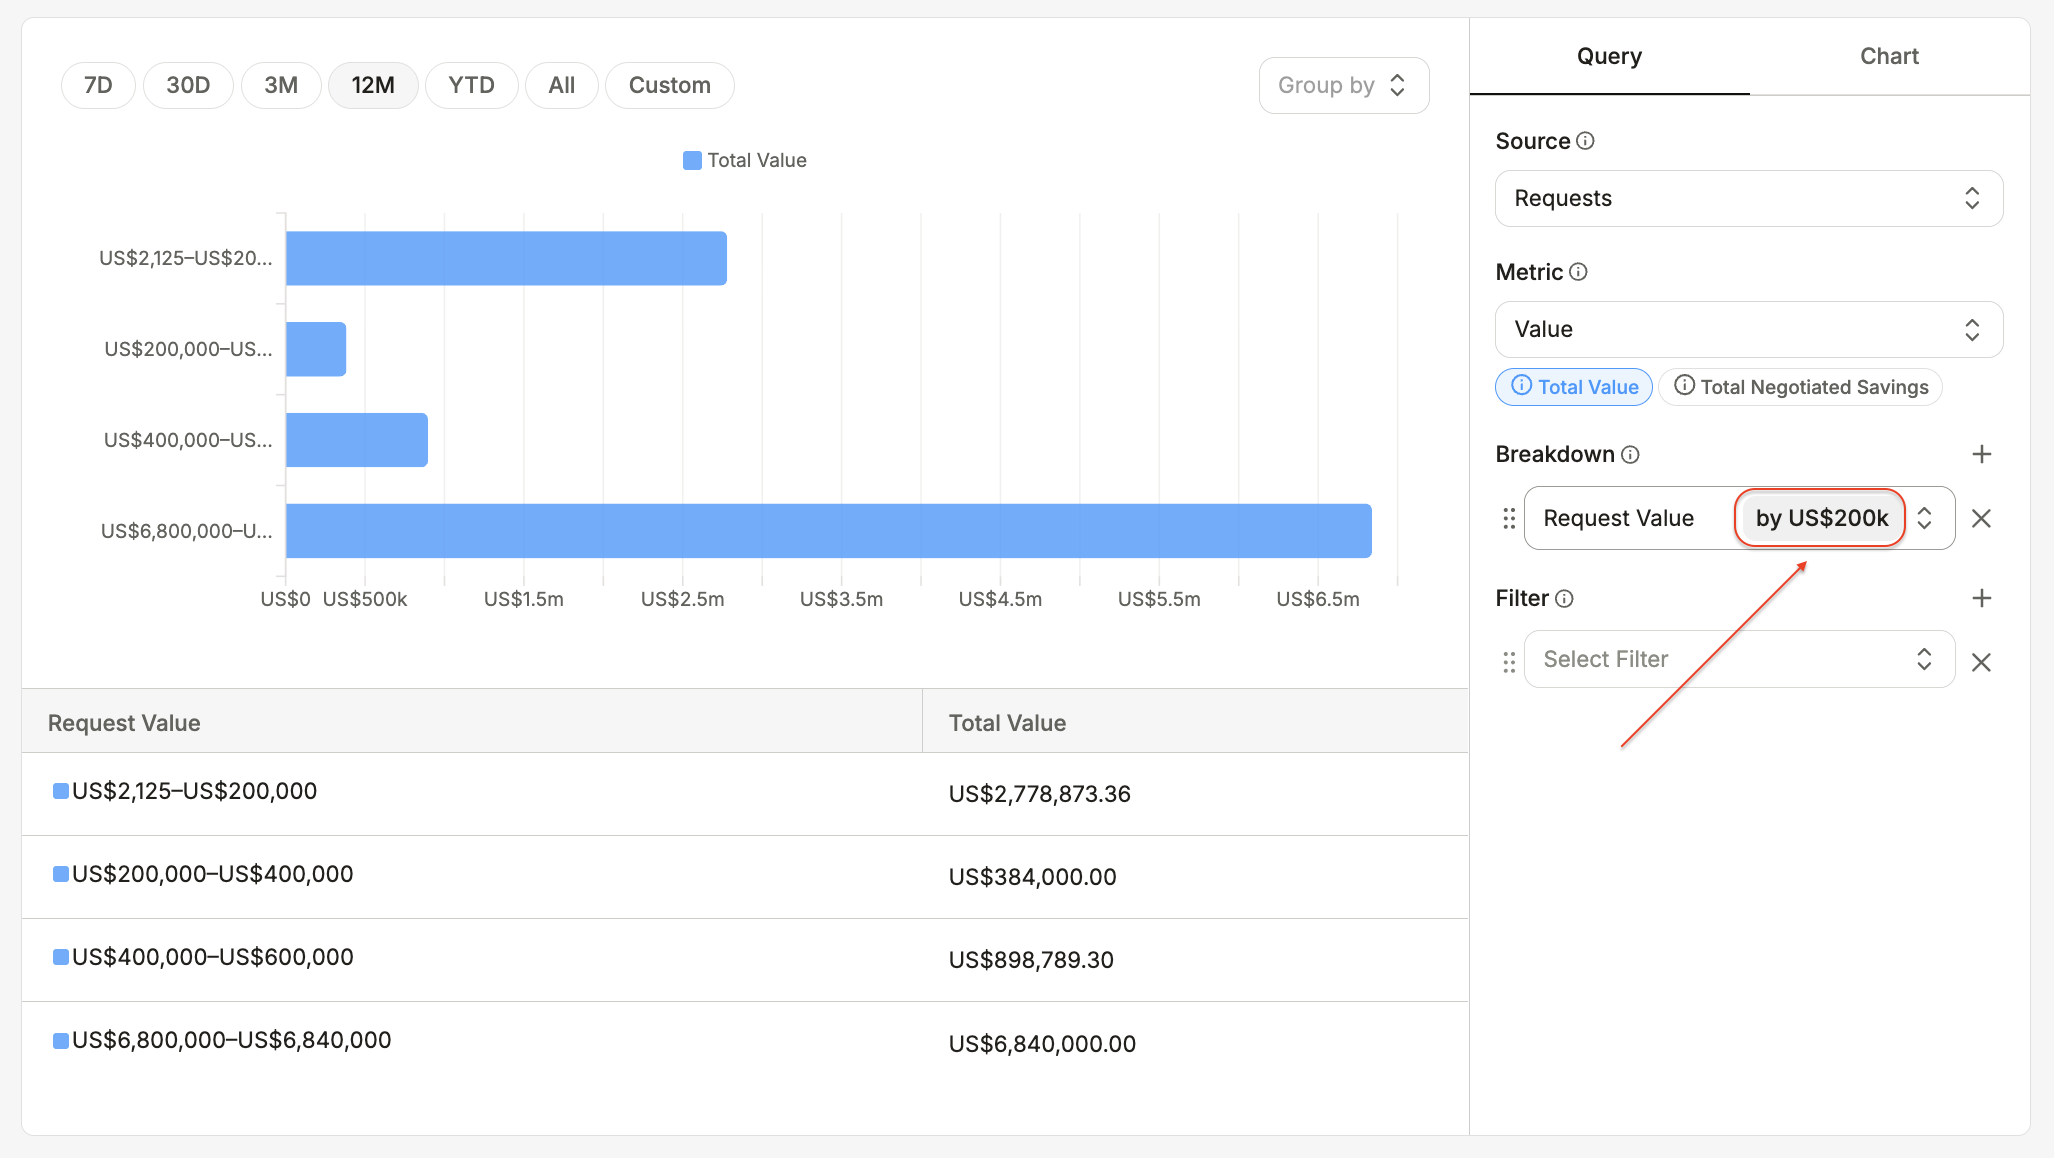
Enter the minimum value, maximum value and group size. Review the resulting ranges and adjust the values as needed.